Transport Realities Across the Arctic: Insights from the InfraNorth Questionnaire Survey
By Alexis Sancho-Reinoso
What questions can travel across communities that share little beyond snow and latitude, and still make sense in each place? That was the challenge we faced in the InfraNorth project as we set out to understand transport infrastructure across the Arctic. Alongside rich qualitative methods such as ethnography, interviews, and community workshops, we designed a questionnaire survey to gather comparable data from field sites scattered across the circumpolar North. But creating a single set of questions that would make sense in such diverse places was no easy task. The solution? Keep it simple, keep it short. The questionnaire was born from a clear premise: to be useful and comparable, it had to be as understandable as possible—without losing sight of local realities.
The InfraNorth questionnaire had to stay tightly focused on our core research question: How do people in the Arctic experience and interact with transport infrastructure? To get to the heart of this, we formulated three key themes:
(1) How do communities perceive their local transport infrastructures?
(2) How are these infrastructures actually used? and
(3) How satisfied are people with their actual usage of the infrastructures?
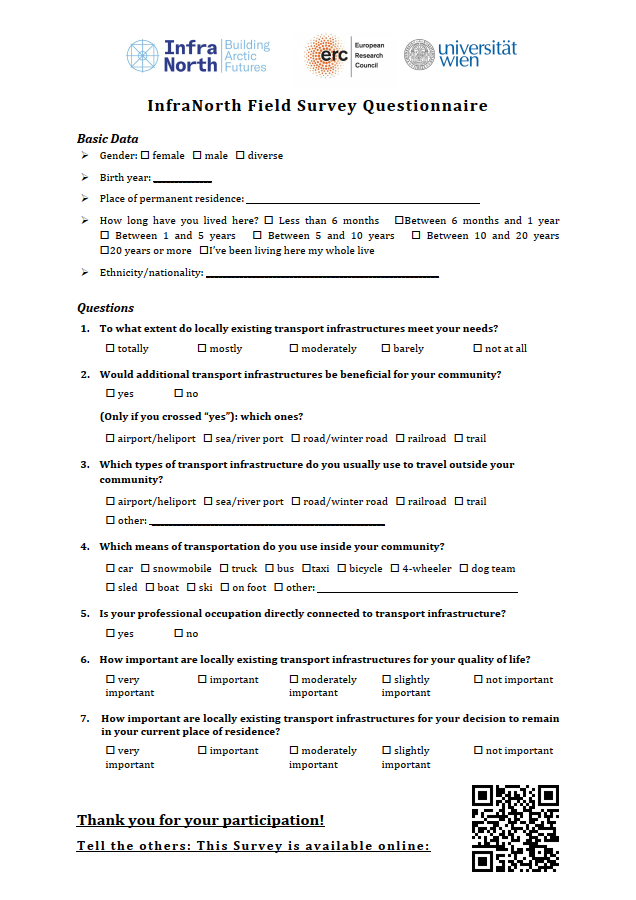
These issues crystallised in seven questions. Three of them were one-choice questions (meaning that respondents had to select a single answer from a Likert scale); further two questions had a multiple-choice character (meaning that respondents were allowed to select more than one option); two questions were yes/no questions, having one of them a sub-question to be answered only if the first question was answered positively (see figure 1).
How we ended up with this particular questionnaire is anything but straightforward. We began creating the questionnaire in 2021, at a time when fieldwork was not possible due to COVID-19 restrictions. As a result, our initial design relied heavily on the team’s prior experience conducting ethnographic research across the Arctic—and beyond. In parallel, we tried to get inspired by pan-Arctic surveys on similar topics, like SLiCA, the Survey of Living Conditions in the Arctic. One key issue is that, at that time, the final selection of the specific case study areas was still open, which prevented us from being too specific in both questions and answers. Only when ethnographic fieldwork was possible again (at least in some areas) in late 2021 onwards, the questionnaire started its testing phase.
The testing phase allowed us to make small adjustments in the questionnaire, most notably to the response options for Question 4—on means of transport—which sparked an especially intense debate. With so many possible options, capturing the full range used across all field sites was challenging. In the end, we opted for an extensive list, accepting the risk of varied responses. Still, we maintained a consistent question structure across all sites to ensure comparability.
We knew from the start that “transport infrastructure” isn’t exactly everyday language—and testing confirmed it. Feedback quickly revealed that the term was often unclear, and explaining it to people unfamiliar with academic jargon was not always easy. The boundaries between infrastructure, transport, and their broader meanings were often fuzzy. Another challenging concept was “quality of life.” As our colleague Katrin Schmid, who worked in Nunavut, pointed out, asking about it risked inviting highly subjective—and potentially biased—answers:
Connections between transport infrastructure, quality of life, and choice to live in their community… aren’t prominent, and the answer isn’t intuitive to people. This means that, in the end, people often just pick a random box, but the response isn’t necessarily representative.
On-site testing didn’t just shape the content—it also highlighted language barriers. Once it became clear that English wouldn’t work everywhere, we translated the questionnaire into Norwegian and Inuktitut to better engage with local communities.
The format of the questionnaire—paper or digital?—also sparked debate within the team. Most researchers favoured paper, as it allowed them to distribute and collect responses directly. The plan was to use a snowball sampling approach, starting with interviewees and extending to their contacts through personal networks. To complement the paper version, we developed an online questionnaire using the SoSci open-source tool, which we launched in June 2022. This allowed us to store data on the University of Vienna’s servers, in full compliance with our project Data Management Plan. Later, the paper and the online versions were linked through a QR code at the foot of the paper questionnaire (see figure 1).
What did we learn from the questionnaire?
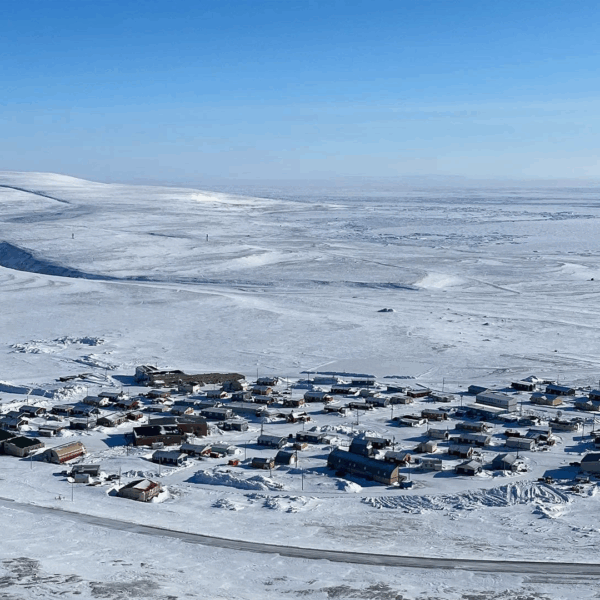
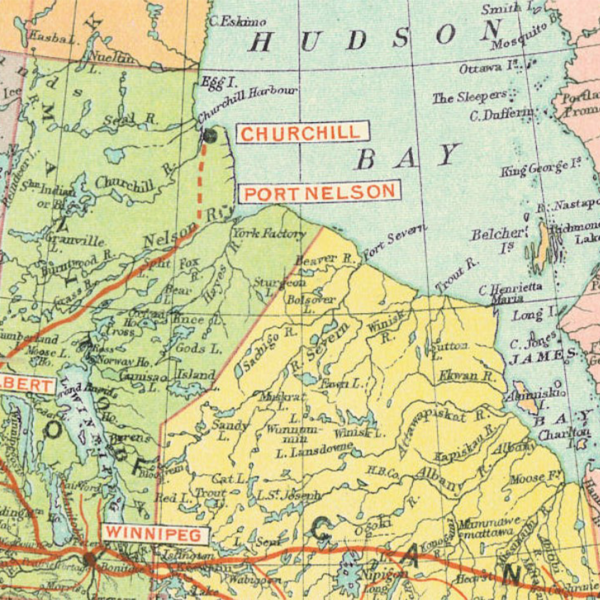
By Spring 2024, we had collected 320 valid responses: 269 from the paper version and 51 from the online version. Of these, 198 responses came from the North American Arctic, and 121 from the European Arctic. We obtained responses from all case study areas, yet in rather uneven amounts. This is by no means surprising given the extreme demographic differences among the sites. Our selection encompassed 12 places across the North American and European Arctic, ranging from large cities such as Rovaniemi in Finnish Lapland (pop.: 54,932) to small towns like Churchill in Northern Manitoba (pop.: 870), and hamlets such as Resolute Bay and Grise Fiord in Nunavut (pop: 226 and 145, respectively). In the latter cases, we managed to collect a good number of responses in relative terms, so that we could reach a significant proportion of the total adult population. Not surprisingly, we have not managed the same numbers in larger settlements.
Despite the geographically uneven sample, the questionnaire revealed some interesting insights. For instance, we observed a gender gap regarding whether additional transport infrastructures would benefit the community: male respondents were more likely than female respondents to strongly agree with this statement (91 vs. 78%). We also saw a 10% gap between North American and European Arctic communities (88% vs. 78%), though only the gender gap was statistically significant, meaning that the result is unlikely to have arisen by chance. Put differently, based on a chi-square statistical test, the gender gap likely reflects broader population trends, while the continental comparison should be interpreted with caution. Indeed, clustering settlements in a macroregional (continental) scale risks oversimplification: do Kiruna and Kirkenes on one side, or Churchill and Iqaluit on the other, really have much more in common just because they belong to the same continent?
We hope this post has offered a glimpse into how complex it can be to design a questionnaire that works across cultures, languages, and regions. Creating the right kind of questions for such a diverse Arctic region was no easy task, but through collaboration, adaptation, and plenty of trial and error, we found a way forward.